I Got Fruit Opinions
Back in 2008, Randall Munroe, creator of xkcd, put up this comic.
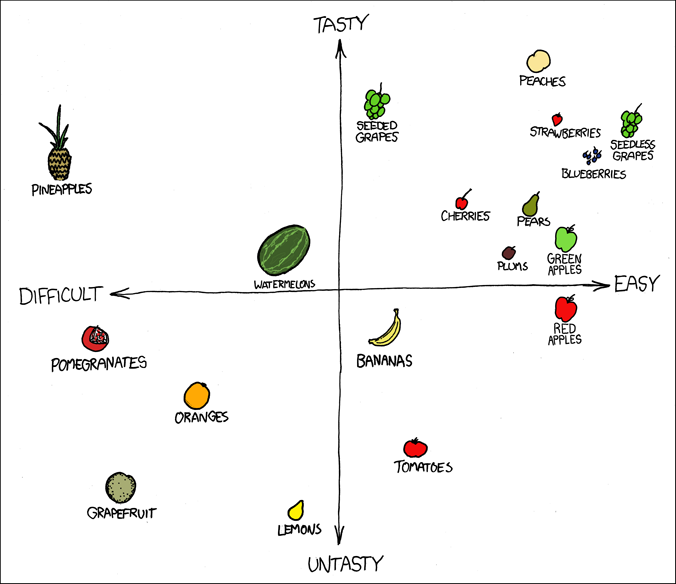
In a perfect storm of bikeshedding, this comic was by far his most controversial ever. He got more email from this than his endorsement of Obama. It seemed that everyone had a different opinion about fruit, and wanted to tell Randall exactly how wrong he was.
For a while, I’ve wanted to know what the average fruit opinion is. One day, I decided to stop being lazy and make a survey for this.
Survey Design
Participants rated each fruit’s difficulty and tastiness on a scale from 1 to 10. I shared the survey among my Facebook friends, the xkcd subreddit, and the SampleSize subreddit. One of my friends reshared the survey to the UC Berkeley Computer Science group.
Along the way, I got some comments about the survey’s design. My surveyed population is biased towards people who frequent those subreddits, and placing the xkcd comic at the start of the survey biases participants. It’s true, but in my defense, I wanted to give context for why I was conducting this survey, and the survey is about fruit. Literally fruit. It wasn’t supposed to be a big deal.
Analysis
In total, I got over 1300 responses. Before going into results, fun fact: everyone’s fruit opinion is indeed unique. No two responses had the exact same fruit rating. To be fair, it would be more surprising if this weren’t true, since I asked for ratings on over 20 different fruits. In fact, it would have been incredibly strange if I did find two people with the exact same rating.
Results
The five most difficult fruits are
- Pineapple
- Pomegranate
- Honeydew
- Grapefruit
- Cantaloupe
Pineapple and pomegranate are the clear losers here. Honeydew, grapefruit, and cantaloupe are all roughly tied in difficulty.
The five easiest fruits are
- Seedless Grapes
- Blueberries
- Strawberries
- Bananas
- Red Apples
No surprises here.
Now, onto taste. The five worst tasting fruits are
- Lemons
- Grapefruit
- Tomatoes
- Honeydew
- Cantaloupe
As a fellow grapefruit hater, I approve. As a fan of cantaloupe, I question people’s judgment.
The five best tasting fruits are
- Strawberries
- Seedless Grapes
- Peaches
- Blueberries
- Mango
Personally, I’m surprised seedless grapes was 2nd, while seeded grapes was 13th. It’s not a small difference either - here are the two histograms.
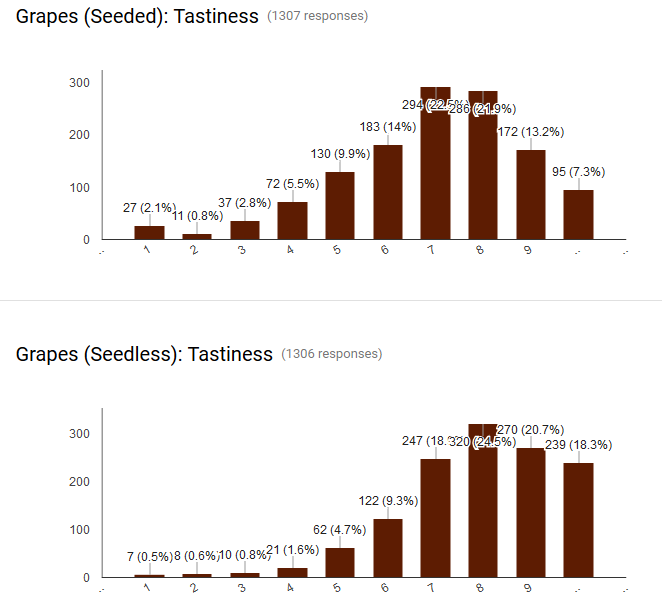
Seems like it was hard to disentangle the taste of the fruit from its difficulty.
Finally, controversial fruits. I measured this by fitting a normal distribution to the cloud of replies for each fruit. The distribution is fitted to difficulty and tastiness simultaneously. A fruit is controversial if its normal distribution has large variance.
The five least controversial fruits are
- Strawberries
- Seedless Grapes
- Oranges
- Blueberries
- Tangerines
By definition, this shouldn’t be surprising.
The five most controversial fruits are
- Tomatoes
- Grapefruit
- Mango
- Watermelon
- Lemons
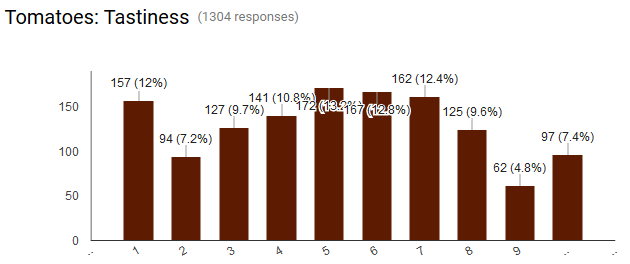
Yep, the tastiness of tomatoes was definitely controversial - this is almost like a uniform distribution, compared to the histograms for grapes. Also, congratulations to mango, for being both controversial and in the top five tastiest fruits.
Graphs
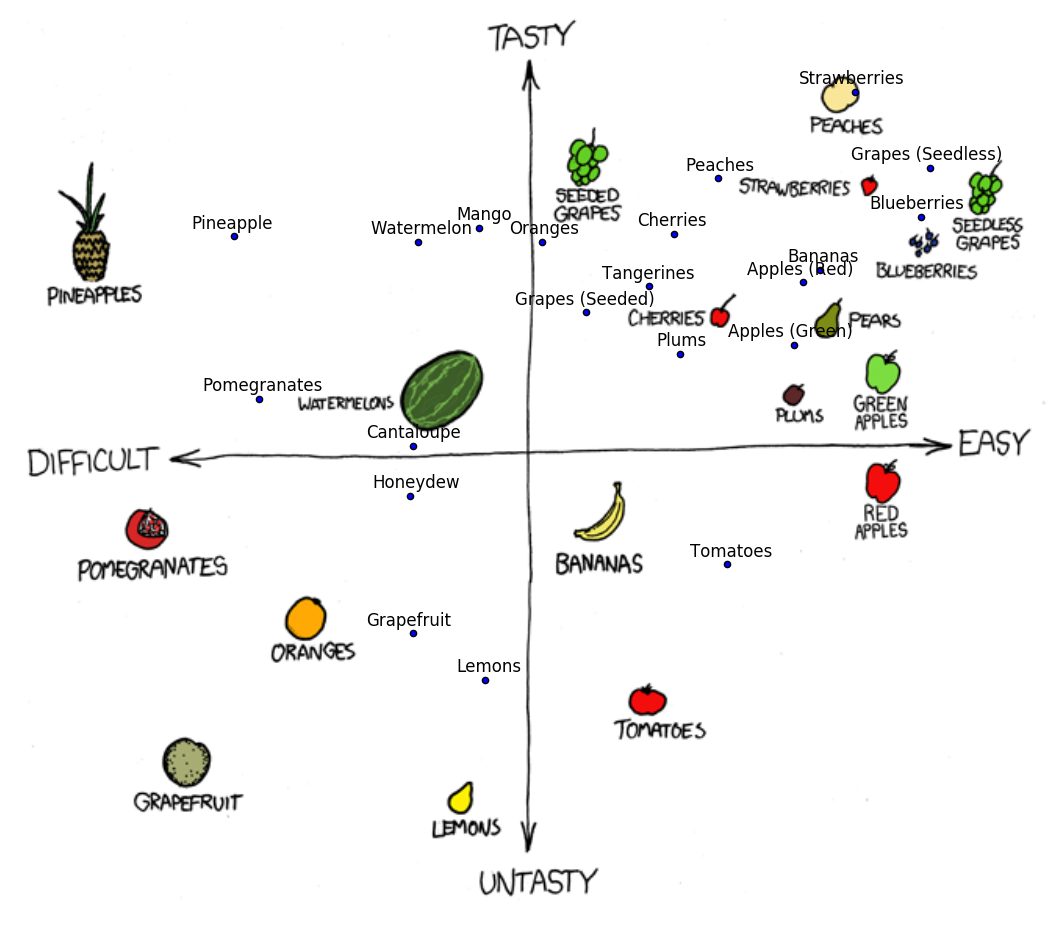
I had to bend the numbers a little bit here. It turns out the average tastes for each fruit are a lot closer than their average difficulty. Stretching the taste-axis exaggerates the relative difference between fruits without changing their ranking.
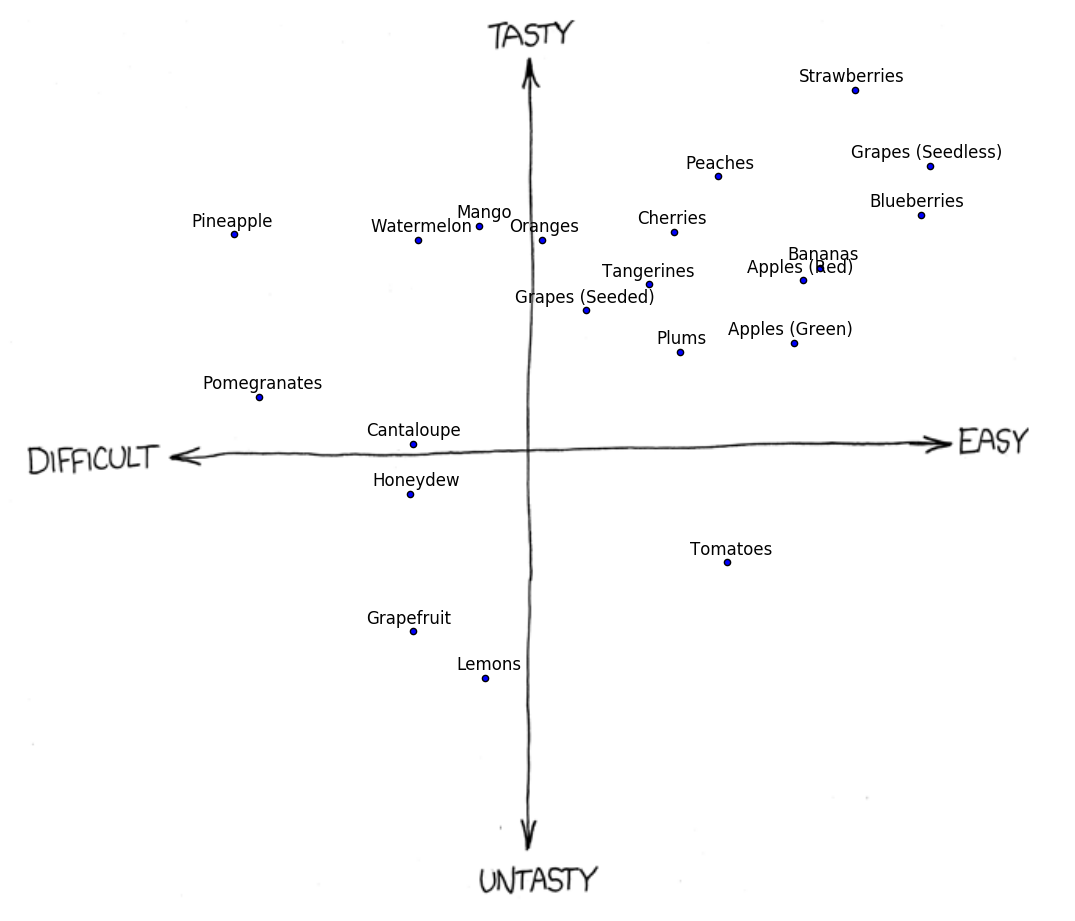
Here’s the same plot overlaid onto the original comic, if you want to compare and contrast.
Finally, here’s the plot with confidence ellipses from the fitted normal distributions, to visualize controversy. Don’t read too much into the absolute size of each ellipse. Only a small fraction of responses actually lie within each ellipse, but drawing a 90% confidence ellipse would have made the ellipses overlap more than they already do.
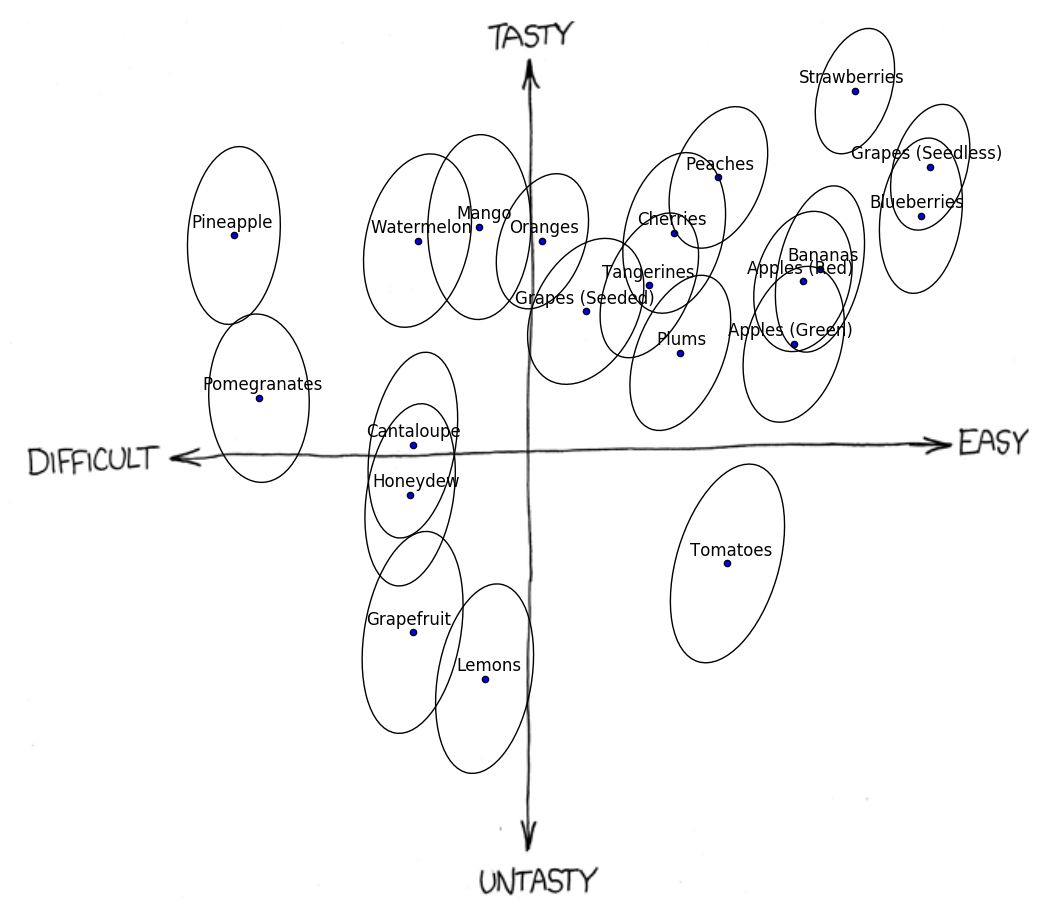
For the technically inclined, a CSV of responses can be downloaded here, and the code used to create these graphs can be seen here (requires NumPy and Matplotlib).